

Prove that brand investment creates demand.

Prove that brand investment creates demand.

Prove that brand investment creates demand.

Prove that brand investment creates demand.

Continuous market and competitive signals, survey and qualitative research, and a governed API that delivers the evidence into your data platform and your AI tools. So leaders can see what the market thinks, what buyers do, and what the business earns, in one connected view.

Continuous market and competitive signals, survey and qualitative research, and a governed API that delivers the evidence into your data platform and your AI tools. So leaders can see what the market thinks, what buyers do, and what the business earns, in one connected view.

Continuous market and competitive signals, survey and qualitative research, and a governed API that delivers the evidence into your data platform and your AI tools. So leaders can see what the market thinks, what buyers do, and what the business earns, in one connected view.

3,000+

public, proprietary and partner data sources

6

marketing surfaces measured

90 days

from first decision to governed evidence

Brand-to-demand assistant

ILLUSTRATIVE

“Did the Q2 brand campaign strengthen buyer memory and qualified pipeline?”

Share of voice rose four points during the campaign window. Aided awareness rose five points and unaided three among category buyers in the target segment. Branded search and qualified pipeline followed with a one-quarter lag. The pattern supports a relationship but does not yet prove incremental lift.

BlueOcean · share of voice

Survey · awareness

Your data · pipeline

Next step: validate causality with exposed and control survey groups.

Three questions every marketing leader is asked, and most systems can’t answer.

Three questions every marketing leader is asked, and most systems can’t answer.

Three questions every marketing leader is asked, and most systems can’t answer.

Three questions every marketing leader is asked, and most systems can’t answer.

Dashboards show activity. Leadership wants to know whether brand investment changed the market, whether that change created demand, and what to do next.

Dashboards show activity. Leadership wants to know whether brand investment changed the market, whether that change created demand, and what to do next.

Dashboards show activity. Leadership wants to know whether brand investment changed the market, whether that change created demand, and what to do next.

01

Did brand investment change the market?

Measure awareness, consideration, category entry points and competitive position alongside media investment.

02

Did that change create demand?

Connect brand movement to search, account engagement, pipeline creation, velocity and win rate using appropriate lags.

03

What should marketing do next?

Give leaders evidence they can query inside their own tools to guide budget, message, market and product decisions.

The system should improve a decision, not simply add another dashboard.

Your systems see action. They don’t see belief or explanation.

Your systems see action. They don’t see belief or explanation.

Your systems see action. They don’t see belief or explanation.

Your systems see action. They don’t see belief or explanation.

First-party data records what buyers did. It cannot tell you what the market remembers, why perception moved, or how you compare with competitors before intent appears.

First-party data records what buyers did. It cannot tell you what the market remembers, why perception moved, or how you compare with competitors before intent appears.

First-party data records what buyers did. It cannot tell you what the market remembers, why perception moved, or how you compare with competitors before intent appears.

OBSERVED SIGNALS

How the brand appears across the market

BlueOcean tracks visibility, competitive position, message ownership, creative consistency, trust and market conversation, continuously.

RESEARCH SIGNALS

What buyers remember and why

Surveys quantify awareness, consideration and buyer memory. Interviews, focus groups, communities and open-text analysis explain the needs, language and barriers behind the scores.

FIRST-PARTY SIGNALS

What buyers did and what it earned

Your data platform connects media exposure, web behavior, account activity, pipeline movement, sales outcomes and revenue inside your governed environment.

Together, these signals reveal whether marketing changed memory, behavior and commercial outcomes.

BlueOcean fits inside the measurement architecture you already own.

BlueOcean fits inside the measurement architecture you already own.

BlueOcean fits inside the measurement architecture you already own.

BlueOcean fits inside the measurement architecture you already own.

Your data platform remains the system where data is joined, modeled and presented. BlueOcean adds the evidence about the market and the buyer that first-party systems cannot see.

Your data platform remains the system where data is joined, modeled and presented. BlueOcean adds the evidence about the market and the buyer that first-party systems cannot see.

Your data platform remains the system where data is joined, modeled and presented. BlueOcean adds the evidence about the market and the buyer that first-party systems cannot see.

BLUEOCEAN API

Brand metrics · Competitor benchmarks · Content and creative signals · Media context · Regular refresh

RESEARCH EVIDENCE

Survey measures · Interviews · Focus groups · Buyer language · Barriers · Tested hypotheses

YOUR DATA + MODELS

Media · Web · CRM · Accounts · Pipeline · Revenue · Identity · Governance · Causal models

YOUR AI EXPERIENCES

Executive answers · Alerts · Forecasts · Planning recommendations · Campaign learning

Brand becomes the governing context that connects what the market thinks, what buyers do and what the business earns.

Machine-readable evidence with lineage, not another isolated scorecard.

Machine-readable evidence with lineage, not another isolated scorecard.

Machine-readable evidence with lineage, not another isolated scorecard.

Machine-readable evidence with lineage, not another isolated scorecard.

Every observation the API delivers carries the same six dimensions, so it lands in your tables ready to join with media, pipeline and revenue.

Every observation the API delivers carries the same six dimensions, so it lands in your tables ready to join with media, pipeline and revenue.

Every observation the API delivers carries the same six dimensions, so it lands in your tables ready to join with media, pipeline and revenue.

METRIC

Awareness, distinctiveness, consistency, impact, trust and category-entry-point measures

ENTITY

Brand, competitor, product, audience, account segment, geography

TIME

Observation date, reporting period, campaign window and applicable lag

EVIDENCE

Source, survey sample, qualitative method, confidence and comparability flags

CONTEXT

Market event, media activity, creative theme, buyer language and competitive movement

ACCESS

BlueOcean API into your governed tables, with research outputs attached. Or connect via MCP to Slack, Teams, Power BI and more.

The API shows the movement. Research validates it and explains it.

The API shows the movement. Research validates it and explains it.

The API shows the movement. Research validates it and explains it.

The API shows the movement. Research validates it and explains it.

A four-stage research program runs alongside the continuous signal, so unexpected movement gets a reason and every wave sharpens the next hypothesis.

A four-stage research program runs alongside the continuous signal, so unexpected movement gets a reason and every wave sharpens the next hypothesis.

A four-stage research program runs alongside the continuous signal, so unexpected movement gets a reason and every wave sharpens the next hypothesis.

01

Baseline

Supplement awareness, consideration, category-entry-point links, trust and distinctive-asset recognition.

02

Quantify

Use surveys to measure change by market, buyer role and product area.

03

Explain

Use interviews, focus groups, communities and open text to understand why movement occurred.

04

Link

Store coded themes and evidence alongside API, media and commercial data in your platform.

Design principles

Use category buyers, not only customers. Keep trend questions stable. Use qualitative work to interpret unexpected movement and develop better hypotheses. Preserve respondent privacy and evidence lineage.

A brand-to-demand command center, inside your own tools.

A brand-to-demand command center, inside your own tools.

A brand-to-demand command center, inside your own tools.

A brand-to-demand command center, inside your own tools.

BlueOcean and research add market memory to the media, pipeline and revenue data already governed in your platform. Your AI assistant answers the question in context. All figures below are illustrative.

BlueOcean and research add market memory to the media, pipeline and revenue data already governed in your platform. Your AI assistant answers the question in context. All figures below are illustrative.

BlueOcean and research add market memory to the media, pipeline and revenue data already governed in your platform. Your AI assistant answers the question in context. All figures below are illustrative.

SHARE OF VOICE

34%

+4 pts

BlueOcean

AIDED AWARENESS

71%

+5 pts

Survey

UNAIDED AWARENESS

38%

+3 pts

Survey

Brand indicators over four quarters

Percentage of category buyers, illustrative
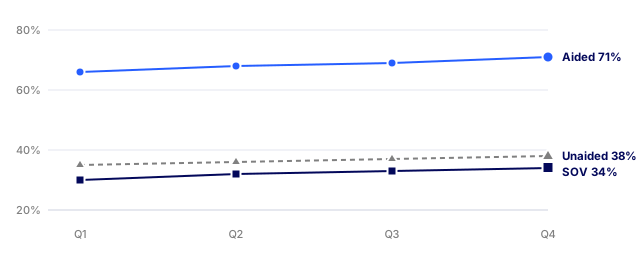
Aided awareness (survey)

Share of voice (BlueOcean)

Unaided awareness (survey)

DEMAND SIGNALS IN YOUR PLATFORM

MEDIA SPEND

$12.4M

+8%

SHARE OF MEDIA

37%

+12%

QUALIFIED PIPELINE

$84M

+9%

WIN RATE

27%

+2 pts

ASK YOUR AI ASSISTANT

“Did the increase in share of voice create demand?”

GOVERNED ANSWER

Share of voice increased four points from Q2 to Q4. Aided awareness rose five points and unaided awareness rose three points over the same period.

Branded search and qualified pipeline also increased. The pattern supports a relationship, but does not prove incremental advertising lift.

Validate causality with exposed and control survey groups

FROM INSIGHT TO ACTION

Your AI turns the measurement system into a decision loop.

Your AI turns the measurement system into a decision loop.

Your AI turns the measurement system into a decision loop.

Your AI turns the measurement system into a decision loop.

Each answer should change a workflow, and every outcome should improve the next answer.

Each answer should change a workflow, and every outcome should improve the next answer.

Each answer should change a workflow, and every outcome should improve the next answer.

EXPLAIN

What happened?

Join market, survey and business evidence.

DIAGNOSE

Why did it happen?

Compare audiences, messages, competitors and timing.

PREDICT

What may happen next?

Model leading indicators and appropriate lags.

RECOMMEND

What should change?

Propose an action with evidence and confidence.

ACTIVATE

Where should it happen?

Put the decision into planning and operating workflows.

LEARN

Did it work?

Measure the result and improve the next recommendation.

BlueOcean expands what the system can know. Your platform connects it to outcomes. Your AI makes it usable when a decision is being made.

Built to improve specific investment, product and competitive decisions.

Built to improve specific investment, product and competitive decisions.

Built to improve specific investment, product and competitive decisions.

Built to improve specific investment, product and competitive decisions.

Start with one decision where BlueOcean, research and your first-party data each contribute distinct evidence.

Start with one decision where BlueOcean, research and your first-party data each contribute distinct evidence.

Start with one decision where BlueOcean, research and your first-party data each contribute distinct evidence.

BRAND INVESTMENT

Did increased brand investment strengthen buyer memory and qualified pipeline?

Reallocate budget across brand and demand.

PRODUCT COMPETITION

Is our new product gaining awareness and consideration against the challenger in its category?

Change product positioning, message or launch investment.

CAMPAIGN LEARNING

What changed in the minds and actions of enterprise buyers?

Scale, revise or stop the campaign.

COMPETITIVE WARNING

Where are our top competitors gaining ground, and why?

Respond before account and pipeline performance declines.

MARKET ALLOCATION

Which market, audience or product should receive the next investment?

Direct budget toward momentum and commercial potential.

AI VISIBILITY

How does our brand appear when buyers ask AI tools about the category?

Improve content, citations and message accuracy.

Value grows as BlueOcean moves from a destination to governed context inside the systems where teams decide.

Value grows as BlueOcean moves from a destination to governed context inside the systems where teams decide.

Value grows as BlueOcean moves from a destination to governed context inside the systems where teams decide.

Value grows as BlueOcean moves from a destination to governed context inside the systems where teams decide.

Each stage retains the value of the one before it and makes the accumulated context more useful.

Each stage retains the value of the one before it and makes the accumulated context more useful.

Each stage retains the value of the one before it and makes the accumulated context more useful.

01

BLUEOCEAN USERS

Teams use BlueOcean directly for continuous brand and competitive intelligence.

02

API INTEGRATION

BlueOcean data flows into measurement systems with consistent definitions, lineage and cadence.

03

KNOWLEDGE + AI

Strategic insights accumulate in knowledge bases and appear through AI reporting systems.

04

WORKFLOW DECISIONS

Brand context becomes part of planning, investment, creative and product decisions.

DATA CONTINUITY

Your competitive history is a strategic asset. It should move forward with the system.

Your competitive history is a strategic asset. It should move forward with the system.

Your competitive history is a strategic asset. It should move forward with the system.

Your competitive history is a strategic asset. It should move forward with the system.

Competitors can buy tools and collect new data. They cannot instantly recreate your accumulated record of how your brand, market and demand system changed over time.

Competitors can buy tools and collect new data. They cannot instantly recreate your accumulated record of how your brand, market and demand system changed over time.

Competitors can buy tools and collect new data. They cannot instantly recreate your accumulated record of how your brand, market and demand system changed over time.

01

Preserve

Retain the full competitive history, source lineage, definitions and time periods.

02

Normalize

Create a stable schema across brands, products, audiences, markets and measurement changes.

03

Connect

Join historical brand movement to media, demand, product and commercial outcomes.

04

Compound

Use every new observation and research cycle to improve models, benchmarks and decisions.

Clear roles keep the system simple.

Clear roles keep the system simple.

Clear roles keep the system simple.

Clear roles keep the system simple.

You own the measurement environment. BlueOcean expands what that environment can know.

You own the measurement environment. BlueOcean expands what that environment can know.

You own the measurement environment. BlueOcean expands what that environment can know.

BlueOcean

01

Operate the BlueOcean API and external measurement

02

Provide survey and qualitative research tools

03

Deliver structured outputs, metadata and interpretation

Your team

01

Ingest and govern all measurement data

02

Join first-party and external sources

03

Model contribution, lift and commercial relationships

04

Present results in your AI and BI tools

Shared

01

Agree metric definitions and cadence

02

Validate analytical assumptions

03

Review findings against real market activity

04

Prioritize the next tests

Three ways to start, with the API as the common foundation.

Three ways to start, with the API as the common foundation.

Three ways to start, with the API as the common foundation.

Three ways to start, with the API as the common foundation.

Research depth can expand with the importance of the decision.

Research depth can expand with the importance of the decision.

Research depth can expand with the importance of the decision.

01

API Foundation

Continuous BlueOcean metrics and competitive context delivered into your governed tables.

Brand, competitor and content signals on a regular refresh

Six-dimension evidence schema with lineage

MCP connections to the tools your team already uses

Fastest integration

02

API + Survey

The API plus repeatable quantitative research to measure awareness, consideration, category entry points and brand lift.

Everything in API Foundation

Baseline and wave surveys among category buyers

Exposed and control designs for lift measurement

Stronger validation

03

API + Full Research

The API and survey layer plus interviews, focus groups, communities and qualitative analysis.

Everything in API + Survey

Qualitative explanation of unexpected movement

Coded themes and buyer language stored beside your data

Recommended

The first 90 days.

The first 90 days.

The first 90 days.

The first 90 days.

Prove fit, data usefulness and decision value before broader deployment.

Prove fit, data usefulness and decision value before broader deployment.

Prove fit, data usefulness and decision value before broader deployment.

01

Define

Weeks 1–3

Choose one market, product area and decision. Confirm the API scope, research design and first-party sources.

02

Connect

Weeks 4–6

Load the BlueOcean API feed into your platform and attach survey and qualitative research outputs.

03

Model

Weeks 7–10

Test brand-to-demand relationships, appropriate lags and the explanations behind observed movement.

04

Activate

Weeks 11–13

Expose approved outputs in your AI tools. Review decisions, gaps and the scale roadmap.

Test the case on one real decision, using capabilities available today.

Test the case on one real decision, using capabilities available today.

Test the case on one real decision, using capabilities available today.

Test the case on one real decision, using capabilities available today.

Bring one market, one product area and one decision your leadership is debating now. We’ll show you what BlueOcean, research and your own data can each contribute.

Bring one market, one product area and one decision your leadership is debating now. We’ll show you what BlueOcean, research and your own data can each contribute.

Bring one market, one product area and one decision your leadership is debating now. We’ll show you what BlueOcean, research and your own data can each contribute.

PILOT SUCCESS LOOKS LIKE

Your team uses the BlueOcean API and research evidence in its own measurement model, answers at least three executive questions, and improves a real marketing decision.

Social

Media

press@blueocean.ai

2026 BlueOcean – All Rights Reserved

Social

Media

press@blueocean.ai

2026 BlueOcean – All Rights Reserved

Social

Media

press@blueocean.ai

2026 BlueOcean – All Rights Reserved

Social

Media

press@blueocean.ai

2026 BlueOcean – All Rights Reserved